On 8 July 2014, in Belo Horizonte, the host nation walked out for a World Cup semifinal and lost 7-1. Brazil 1, Germany 7. Twelve years later it is still the result every football conversation reaches for when it wants a word for unthinkable.
So we asked a narrow, honest question: what would our model have said the morning of that match?
Not with hindsight. We rebuilt the model as it would have stood on the eve of kickoff — refit from scratch on international matches strictly before 8 July 2014, with no knowledge of the result and no data from after that date. The same three-component ensemble we run for 2026, frozen at that point in time.
It favored Brazil. Comfortably.
What the model saw going in
Brazil were the home side — hosts of the tournament, with the home-advantage bump that every rating system applies. And going in, their international rating was marginally ahead of Germany's: 2165 to 2159 on our rolled-forward Elo. Level on paper, with home advantage on top.
Here is what each component produced, where "Brazil win" is a home win and "Germany win" is an away win:
| Component | Brazil win | Draw | Germany win |
|---|---|---|---|
| Elo baseline | 53.9% | 22.0% | 24.1% |
| Dixon-Coles | 66.2% | 18.9% | 14.9% |
| Hierarchical Poisson | 66.9% | 18.3% | 14.8% |
| Ensemble | 62.3% | 19.8% | 17.9% |
The ensemble gave Brazil a 62.3% chance to win the match and Germany 17.9%. The goal-scoring models — Dixon-Coles and Hierarchical Poisson — were even more lopsided than the Elo baseline, because Brazil at home over the preceding decade had a powerful attacking record.
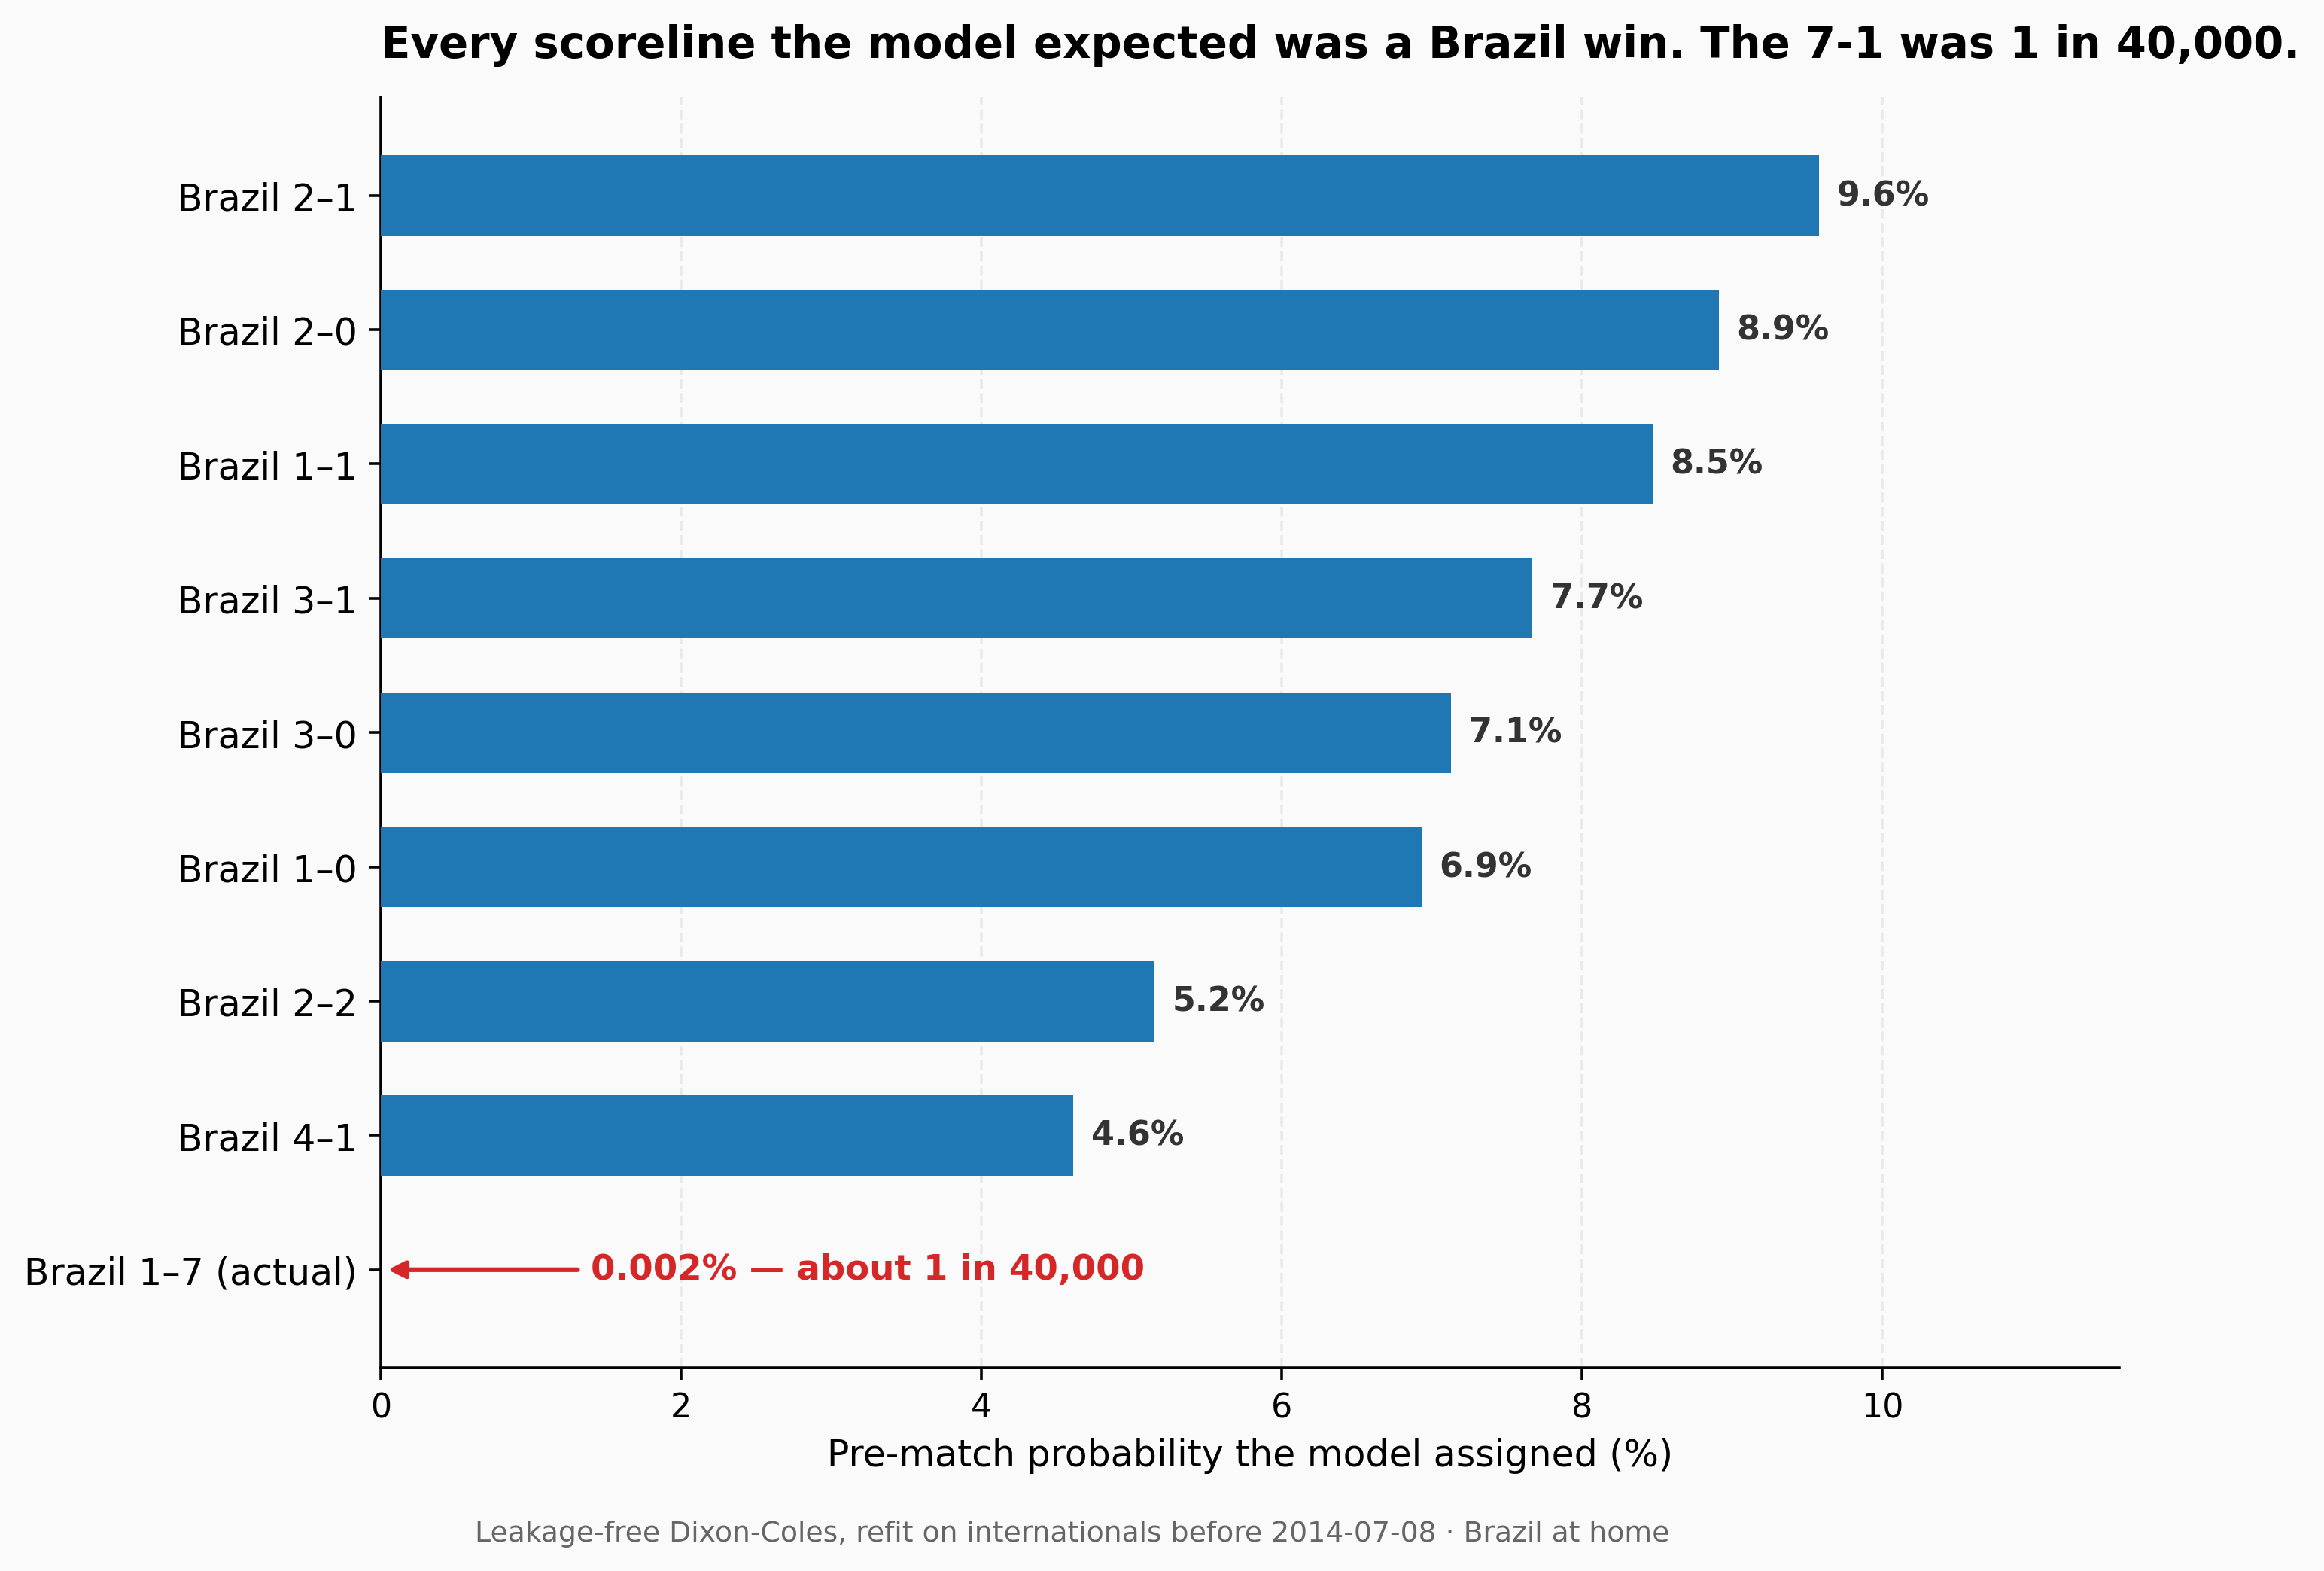
The model's expected goals for the match were Brazil 2.40, Germany 1.08. Its single most likely scoreline was Brazil 2-1, at 9.6%.
This is the right place to be honest about what the model could and couldn't know. A team-strength model reasons about Brazil and Germany as teams. It does not know that Neymar had been carried off in the previous round with a fractured vertebra, or that captain Thiago Silva was suspended. Those two absences gutted the side that actually took the field. The model saw the Brazil of the previous decade, at home, and rated it accordingly. That is not a bug — it is the precise boundary of what this kind of model represents.
To make that boundary concrete: our model's entire representation of Brazil's defense is a single team-level strength parameter, learned from years of goals conceded. The goal-scoring components fit one defensive rating per side and place Brazil's among the strongest in the world — but that rating carries no notion of who starts. Remove the team's best defender and its talisman on the night, and the parameter does not move, because it was never built from line-ups in the first place. The model's defense of Brazil was Brazil's defensive record, not the four players who actually walked out in Belo Horizonte.
How rare was 7-1, exactly?
Our Dixon-Coles model doesn't just produce a win/draw/win split. Under the hood it builds a full distribution over every possible scoreline, which we can read directly. So we can ask: what probability did the model, favoring Brazil, assign to the result that actually happened?
| Scoreline event | Model probability |
|---|---|
| Brazil 2-1 (most likely score) | 9.6% |
| Germany winning by exactly 6 goals | 0.010% |
| Germany winning by 6 or more | 0.011% |
| The actual Brazil 1-7 Germany | ~0.002% |
A probability of 0.002% is roughly one in forty thousand. To put that in perspective, the model thought its single most likely scoreline — a routine Brazil 2-1 — was nearly five thousand times more likely than the scoreline football fans now know by heart.
That number isn't a confession that the model was badly calibrated. It's the opposite. A 7-1 away win against a level-rated home favorite should sit deep in the tail of any sensible distribution. If a model had assigned it even a 1% chance, that model would be wrong about football — it would be telling you collapses like this happen every few matches, when in a century of World Cups this has happened essentially once.
The point
It would be easy, and dishonest, to write the version of this post where we "called it." We didn't. Our model favored the team that lost, by a wide margin, and gave the actual result a one-in-forty-thousand probability. Every credible forecast that morning looked something like ours.
That's the lesson worth keeping. A probability model's job is to be well-calibrated across thousands of matches — to be right, on average, about how often a 60% favorite actually wins. It is not to foresee the individual night when a team without its best defender and its talisman comes apart at the seams against an opponent playing the game of its life. Those nights live in the tail. The model's quiet 0.002% is exactly where they belong.
The most shocking result in World Cup history isn't evidence that prediction is futile. It's a measurement of just how far out on the curve "unthinkable" really is.
Numbers in this post are model outputs from a leakage-free retro-prediction, reproducible from scripts/analysis/germany_brazil_2014_backtest.py — the Dixon-Coles and Hierarchical Poisson components are refit on international matches before 2014-07-08, and pre-match Elo is read immediately before kickoff. They are for research and educational purposes only — not betting advice, not financial advice, not recommendations to gamble. The model can be wrong. Methodology: /docs/methodology/. Full Terms of Use.