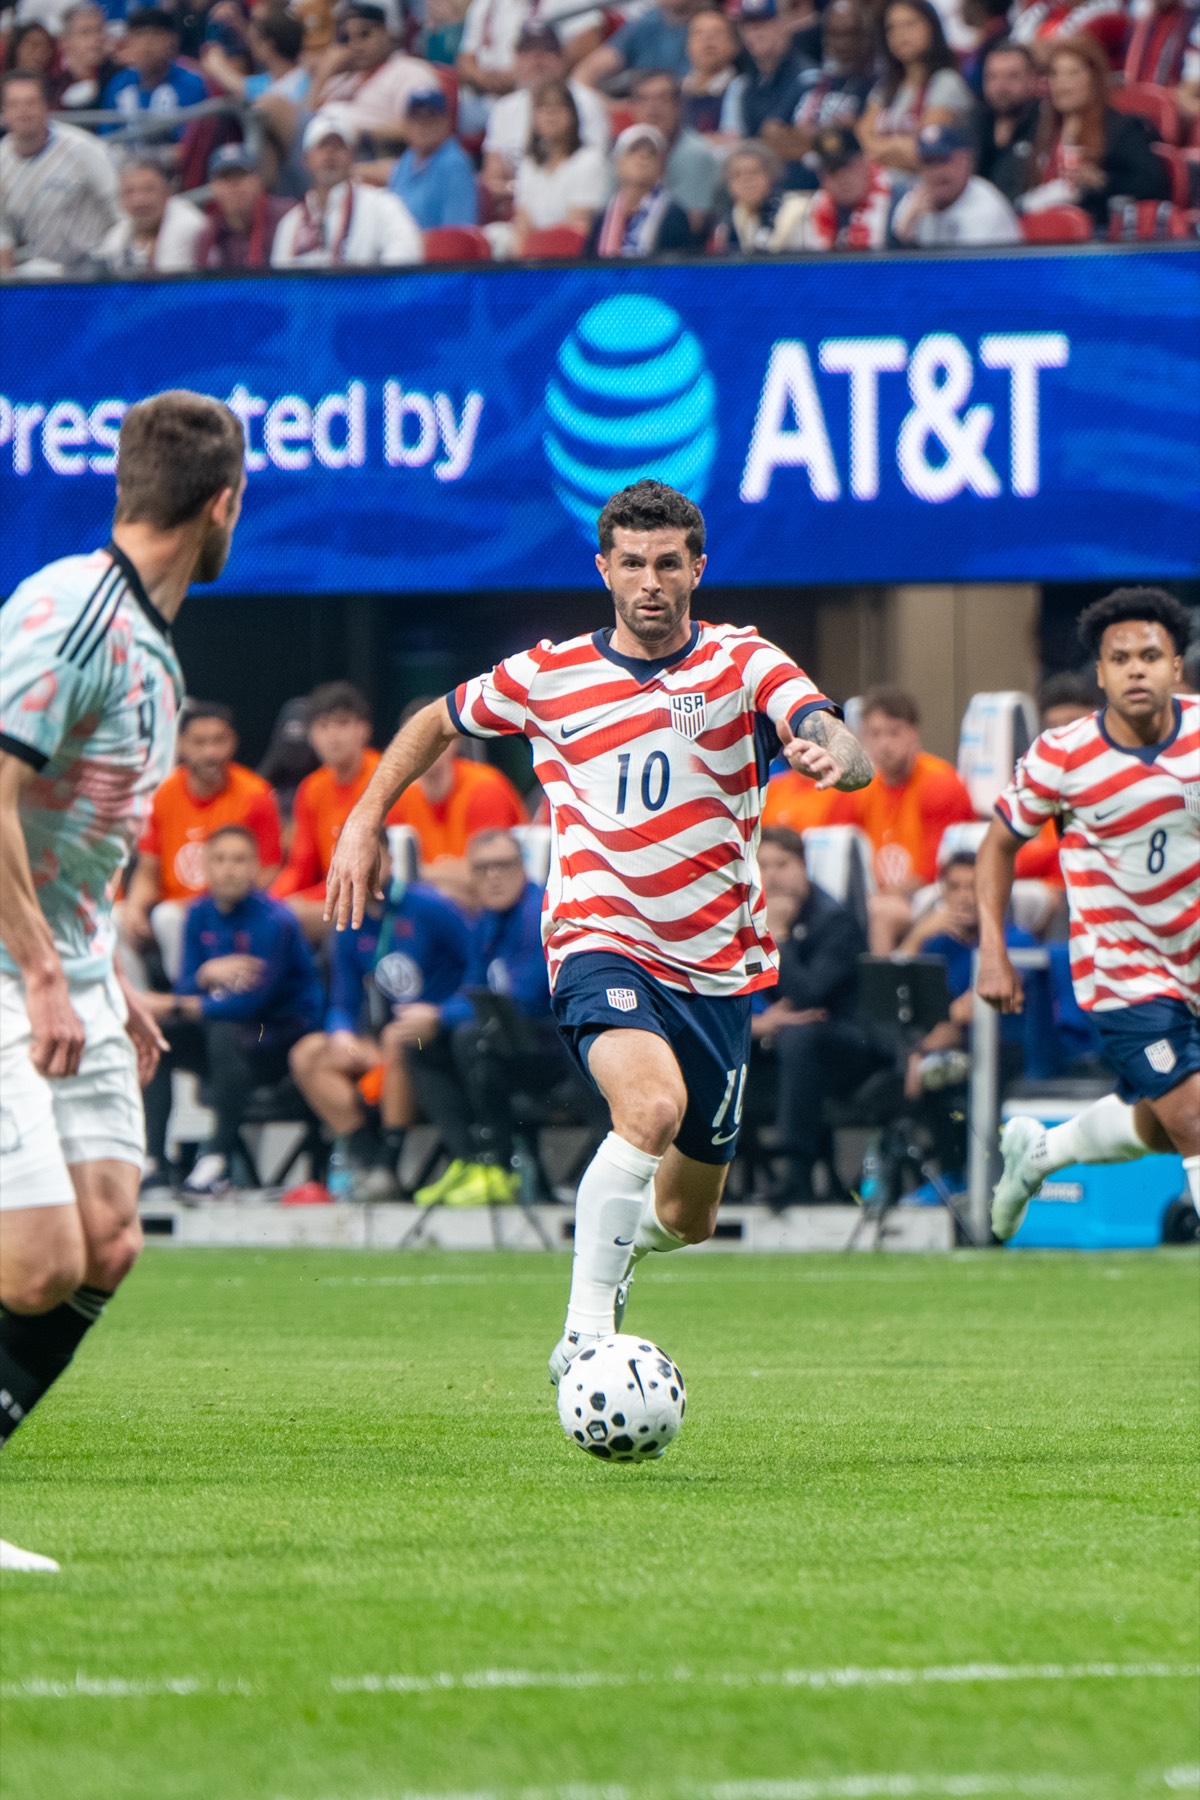
Our model gives the United States a 76.6% chance of advancing from Group D. That makes them the weakest host nation at the 2026 World Cup — by a wide margin.
Mexico advances 95.6% of the time. Canada 95.8%. The USA, playing every group match on home soil, sits nineteen percentage points behind both.
The reason is Group D.
The tightest group in the tournament
Every World Cup has a "group of death" debate. At a 48-team tournament with 12 groups of four, the conventional argument is that the concept is dead — the groups are too diluted, and eight of twelve third-place teams advance anyway.
Group D says otherwise.
The first-place probabilities tell the story:
| Team | Win group | Advance | Eliminated |
|---|---|---|---|
| USA | 31.8% | 78.3% | 23.4% |
| Turkey | 27.6% | 68.4% | 27.4% |
| Australia | 21.6% | 63.9% | 33.5% |
| Paraguay | 19.0% | 64.9% | 37.0% |
The spread between first and last in win-group probability is 12.8 percentage points. For context, here's how that compares to every other group:
| Group | Top seed (win-group %) | Bottom seed (win-group %) | Spread |
|---|---|---|---|
| D | USA (31.8%) | Paraguay (19.0%) | 12.8pp |
| F | Netherlands (52.7%) | Tunisia (4.9%) | 47.8pp |
| B | Switzerland (50.4%) | Qatar (1.4%) | 49.0pp |
| K | Portugal (51.0%) | DR Congo (1.8%) | 49.2pp |
| E | Germany (54.2%) | Curaçao (0.3%) | 53.9pp |
| A | Mexico (62.5%) | South Africa (2.9%) | 59.6pp |
| G | Belgium (61.1%) | New Zealand (2.9%) | 58.2pp |
| I | France (64.5%) | Iraq (0.9%) | 63.5pp |
| L | England (66.6%) | Ghana (0.8%) | 65.7pp |
| C | Brazil (69.3%) | Haiti (0.3%) | 69.0pp |
| H | Spain (76.0%) | Cape Verde (0.5%) | 75.4pp |
| J | Argentina (81.7%) | Jordan (1.6%) | 80.2pp |
Group D's spread is 3.7 times smaller than the next-closest group. In Group J, Argentina dominates at 81.7% to win — the bottom team has a 1.6% chance. In Group D, the bottom team (Paraguay at 19.0%) has a better chance of winning the group than any non-top-seed in any other group in the tournament.
This is not the group of death. It is the group of chaos.
The USA is the underdog in every match
Our model rates the USA as the underdog in all three group-stage fixtures. For a host nation, this is extraordinary.
| Match | USA win | Draw | Opponent win |
|---|---|---|---|
| USA vs Paraguay (June 12, SoFi Stadium) | 32.2% | 29.4% | 38.3% |
| USA vs Australia (June 19, Lumen Field) | 30.9% | 28.1% | 41.0% |
| USA vs Turkey (June 25, SoFi Stadium) | 30.8% | 25.8% | 43.5% |
In no match does the model give the USA better than a one-in-three chance of winning. Paraguay, the team most casual observers would consider the weakest in the group, is the favourite in the opening fixture.
The Elo ratings explain why. Turkey's Elo (1902) is the 14th-highest in the tournament. Paraguay (1833) is 20th. Australia (1783) is 24th. The USA (1721) is 32nd — the lowest-rated team in their own group, and the lowest-rated host in modern World Cup history.
Three hosts, three completely different paths
The draw gave the three host nations wildly different group-stage assignments.
| Host | Group | Elo (rank) | Opp. avg strength | Win group | Advance |
|---|---|---|---|---|---|
| Mexico | A | 1860 (#19) | 1667 | 62.5% | 91.0% |
| Canada | B | 1784 (#23) | 1636 | 45.3% | 91.4% |
| USA | D | 1721 (#32) | 1839 | 31.8% | 78.3% |
Mexico and Canada face group opponents whose average Elo is 1636–1667. The USA faces opponents averaging 1839 — a gap of over 170 Elo points. That's the difference between drawing teams ranked in the mid-30s and drawing teams ranked in the mid-teens.
Canada's group is the gentlest of any host: Switzerland and Bolivia are the strongest opponents, with Qatar making up the fourth. Mexico drew Colombia as a credible threat, but South Africa and Saudi Arabia give them two near-certain wins.
The USA drew three teams that all belong in the conversation for second-round advancement. None of them is a walkover.
Why our model is uncertain — and where it might be wrong
The three component models in the ensemble disagree sharply on the USA's matches, which is itself a signal of genuine uncertainty.
Take the USA–Turkey fixture: the Elo model gives the USA just a 15.1% win probability — it sees the 181-point Elo gap as decisive. The Hierarchical Poisson model gives the USA 45.8% — it thinks the USA's attack and defence parameters, pooled within CONCACAF, justify a much higher estimate. The Dixon-Coles model splits the difference at 31.4%.
That range — from 15% to 46% — is not noise. It reflects a real disagreement about what the USA's recent results mean. Elo tracks only outcomes. The Poisson models decompose results into attack and defence components and apply confederation-level shrinkage. The USA's results in CONCACAF qualifying look different from those models' perspectives than they do from Elo's.
The model also does not have a direct "host advantage" parameter. Any benefit from playing at home — crowd support, no travel fatigue, familiar pitches — is absorbed only indirectly through historical results that happened to be at home. If the hosting effect at a World Cup is larger than what friendly and qualifying home results capture, the model underestimates the USA.
The precedent is mixed. Russia 2018 overperformed their Elo by roughly 200 points worth of results. South Africa 2010 did not. Qatar 2022 was the worst-performing host in tournament history. The last time the USA hosted a World Cup (1994), they advanced from the group stage as one of the best third-place teams and lost to Brazil in the Round of 16.
What has to go right for the USA
The numbers don't mean the USA is doomed. A 76.6% advance probability is still a three-in-four chance. But the margin for error is thin.
If the USA wins the opening match against Paraguay, the path opens. Historically, teams that win their opener at a World Cup advance at a rate far above the base. The problem is that the model sees that match as the tightest of the three — both in win probability and in expected goals (USA 0.90 xG vs Paraguay 0.93 xG). It is likely to be a low-scoring, cagey game.
The worst-case scenario is a loss to Paraguay followed by a loss to Australia. At that point, the USA would need to beat Turkey — the strongest team in the group — in the final match to have any chance of advancing. The model gives the USA a 30.8% chance of winning that match.
The best-case scenario is that the home crowd, the short travel, and the tournament adrenaline push the USA past the margins the model can't see. Group D is tight enough that small edges — a penalty call, a set-piece goal, a red card — are the difference between first place and fourth.
Where to read more
The tournament dashboard — with Group D probabilities, every fixture, and the full 48-team winner table — is at /tournament/. The methodology is at /docs/methodology/.
All numbers in this post are model outputs as of the May 28 snapshot. They are for research and educational purposes only — not betting advice, not financial advice, not recommendations to gamble. The model can be wrong. Methodology: /docs/methodology/. Full Terms of Use.