The 2026 World Cup opens on June 11 at the Estadio Azteca, where Mexico plays the first match of a tournament its country is co-hosting — and the model gives Mexico, Canada and the United States, added together, about a 1.2% chance that one of them lifts it. That is roughly 1 in 87.
To put a frequency on it: across 10,000 simulated tournaments, a host nation is champion about 115 times. The individual probabilities split as Mexico 0.69%, Canada 0.26%, United States 0.20% — three host nations on home soil, and the model still has the home trophy as a long shot.
What 1.2% looks like next to the field
The 48 champion probabilities in the model sum to 1.0, so it helps to read the host number against the teams at the top. As of the June 5 run, the model rates Argentina at 16.2% and Spain at 15.8% — the two clear favourites — then Brazil 9.8%, France 9.0%, Portugal 7.8%, England 6.5% and Germany 5.7%.
Mexico's 0.69% is a sliver of what the model gives the favourites — about one twenty-third of Argentina's number. The combined host figure of ~1.2% is still less than Germany's 5.7% on its own, and Germany is only seventh. The model is not treating the home tournament as a thumb on the scale.
There is a reason for that, and it is worth being explicit about. The model treats every World Cup match as a neutral venue: all 72 fixtures carry a home advantage of zero. There is no explicit home-crowd term in the match engine. So these host numbers are not a crowd bump that the model then discounts — they come entirely from each side's rating. Mexico, Canada and the United States are rated where they are rated, and the Azteca does not move them. That mirrors the model being results-driven rather than narrative-driven, and it means the honest read of "home advantage" here is that whatever benefit the hosts get, the model is capturing it through schedule and seeding, not through atmosphere.
The advantage that is real lives in the group stage
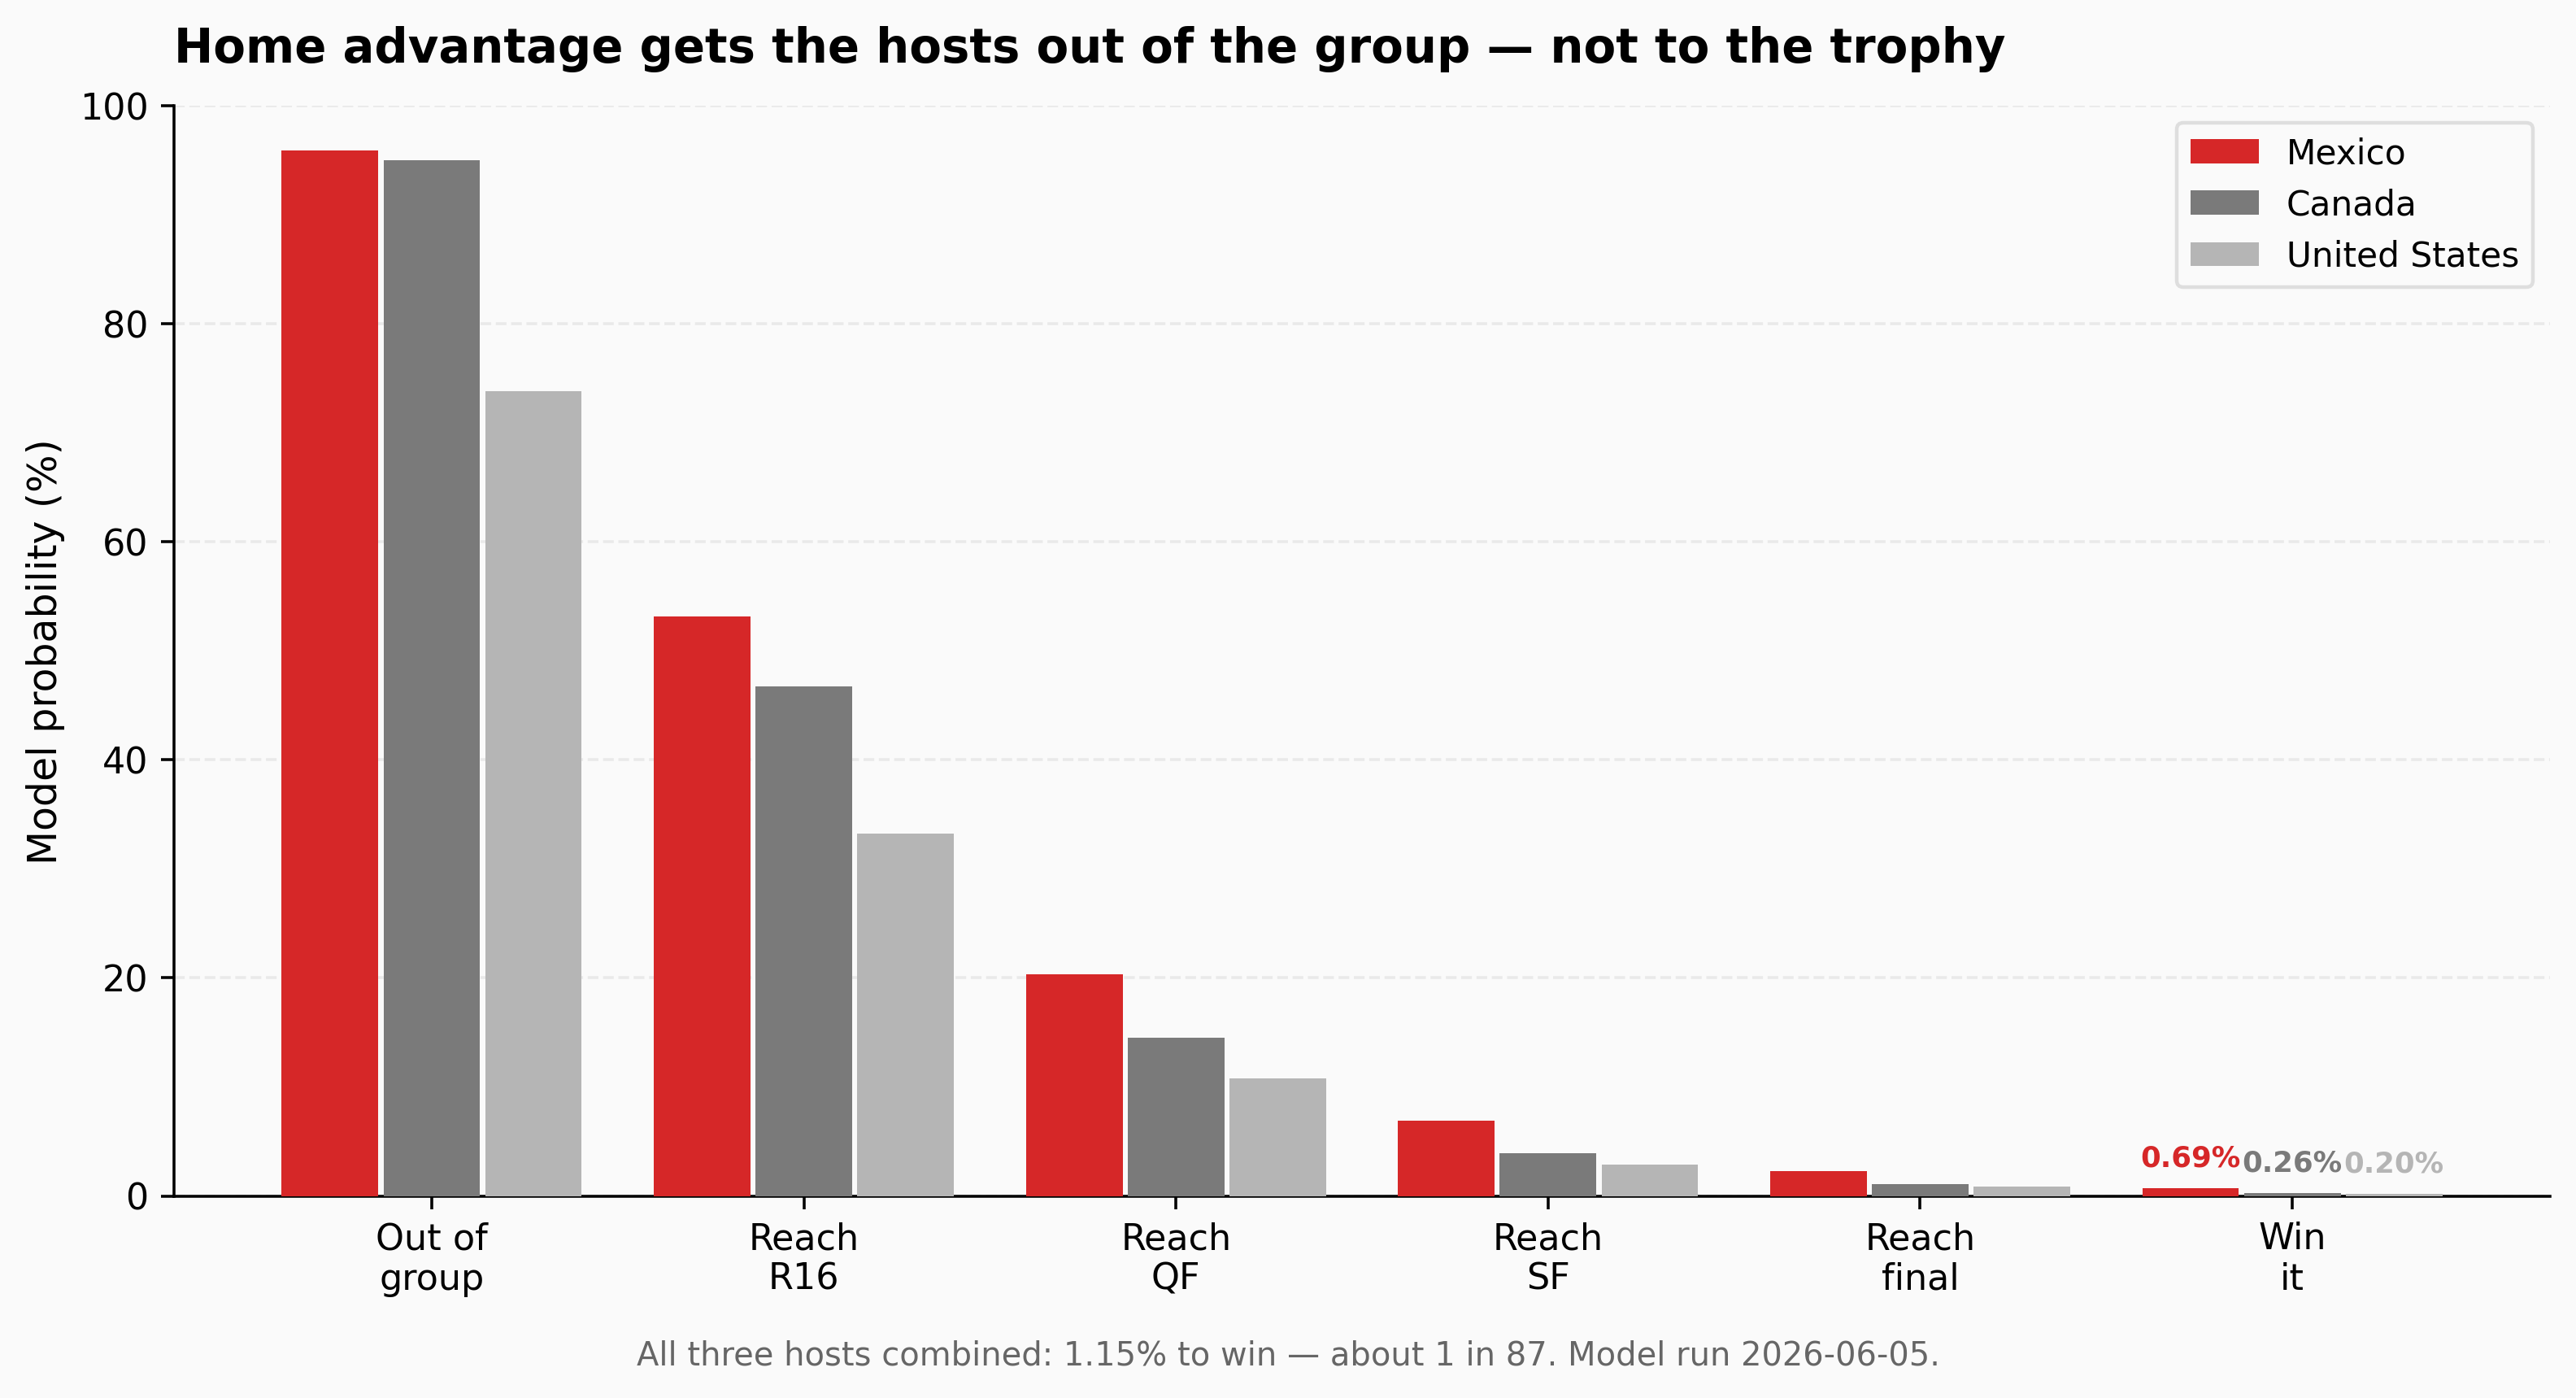
The home tournament does help the hosts — it just helps them early. The clearest way to see it is to walk a single team through the rounds, which is what the chart does for all three. Home advantage gets the hosts out of the group; it does not get them to the trophy.
Round by round, advance-from-group / reach the round of 16 / reach the final / win:
| Host | Advance | R16 | Final | Champion |
|---|---|---|---|---|
| Mexico | 91.0% | 48.4% | 2.3% | 0.69% |
| Canada | 91.4% | 43.1% | 1.1% | 0.26% |
| United States | 78.3% | 35.8% | 0.9% | 0.20% |
Mexico clearing its group in about 96 of every 100 simulated tournaments is a genuinely strong number — it sits among the more comfortable group-stage projections in the field. Canada is right alongside it at 95.0%. The United States is lower at 73.8%, which is a function of its group rather than its hosting status.
Then look at what happens to those numbers as the bracket narrows. Mexico's 95.9% to advance becomes 53.2% to reach the round of 16, ~2.3% to reach the final, and 0.69% to win — each knockout round is roughly a coin flip the model does not expect a host to keep winning. The host advantage, such as it is, is front-loaded: the early matches are where being a strong-ish team in a navigable group pays off, and the knockouts are where the gap to Argentina, Spain and Brazil reasserts itself.
The grouped bars make the shape obvious. Mexico is highlighted, Canada and the United States sit behind it in grey, and the champion bars carry the combined ~1 in 87 annotation. The tall advance bars and the near-flat champion bars are the whole story in one frame.
The opener is closer than a home crowd expects
The tournament's first match is Mexico vs South Africa at the Azteca on June 11, and even there the model is measured. It gives Mexico a 59.5% win probability, a 27.2% draw and 13.4% for South Africa, with expected goals of 1.26 to 0.71 and a most-likely scoreline of 1-0 at 16.9%.
A 59.5% win probability for the home side in the curtain-raiser is short of the 60% that a sellout Azteca might assume. The single most likely outcome is still a 1-0 Mexico win, but the model is putting better than a third of the probability mass on a draw or a South Africa result. The opener is a favourable match, not a formality.
One honest caveat in the other direction: the model has historically been a touch over-confident on its very top favourites, which is a reason to read the Argentina and Spain figures with a little caution. That tendency does not rescue the hosts, though — these host numbers are small under any reading, and a correction for top-end over-confidence would tend to nudge them down, not up.
So the picture for a North American fan is two true things at once. The model likes the hosts' chances of a good group stage — Mexico and Canada are both about 95% to advance, and a deep-ish run is well within range. And the model still has the home trophy at about 1 in 87, because winning a 48-team World Cup means beating the best teams in the world four times in a row, and the Azteca crowd does not show up in that math.
We publish the full 48-team field and refresh it every run. Subscribe and we will send the next update to your inbox.
All numbers in this post are model outputs. They are for research and educational purposes only — not betting advice, not financial advice, not recommendations to gamble. Methodology: link. Full Terms of Use.