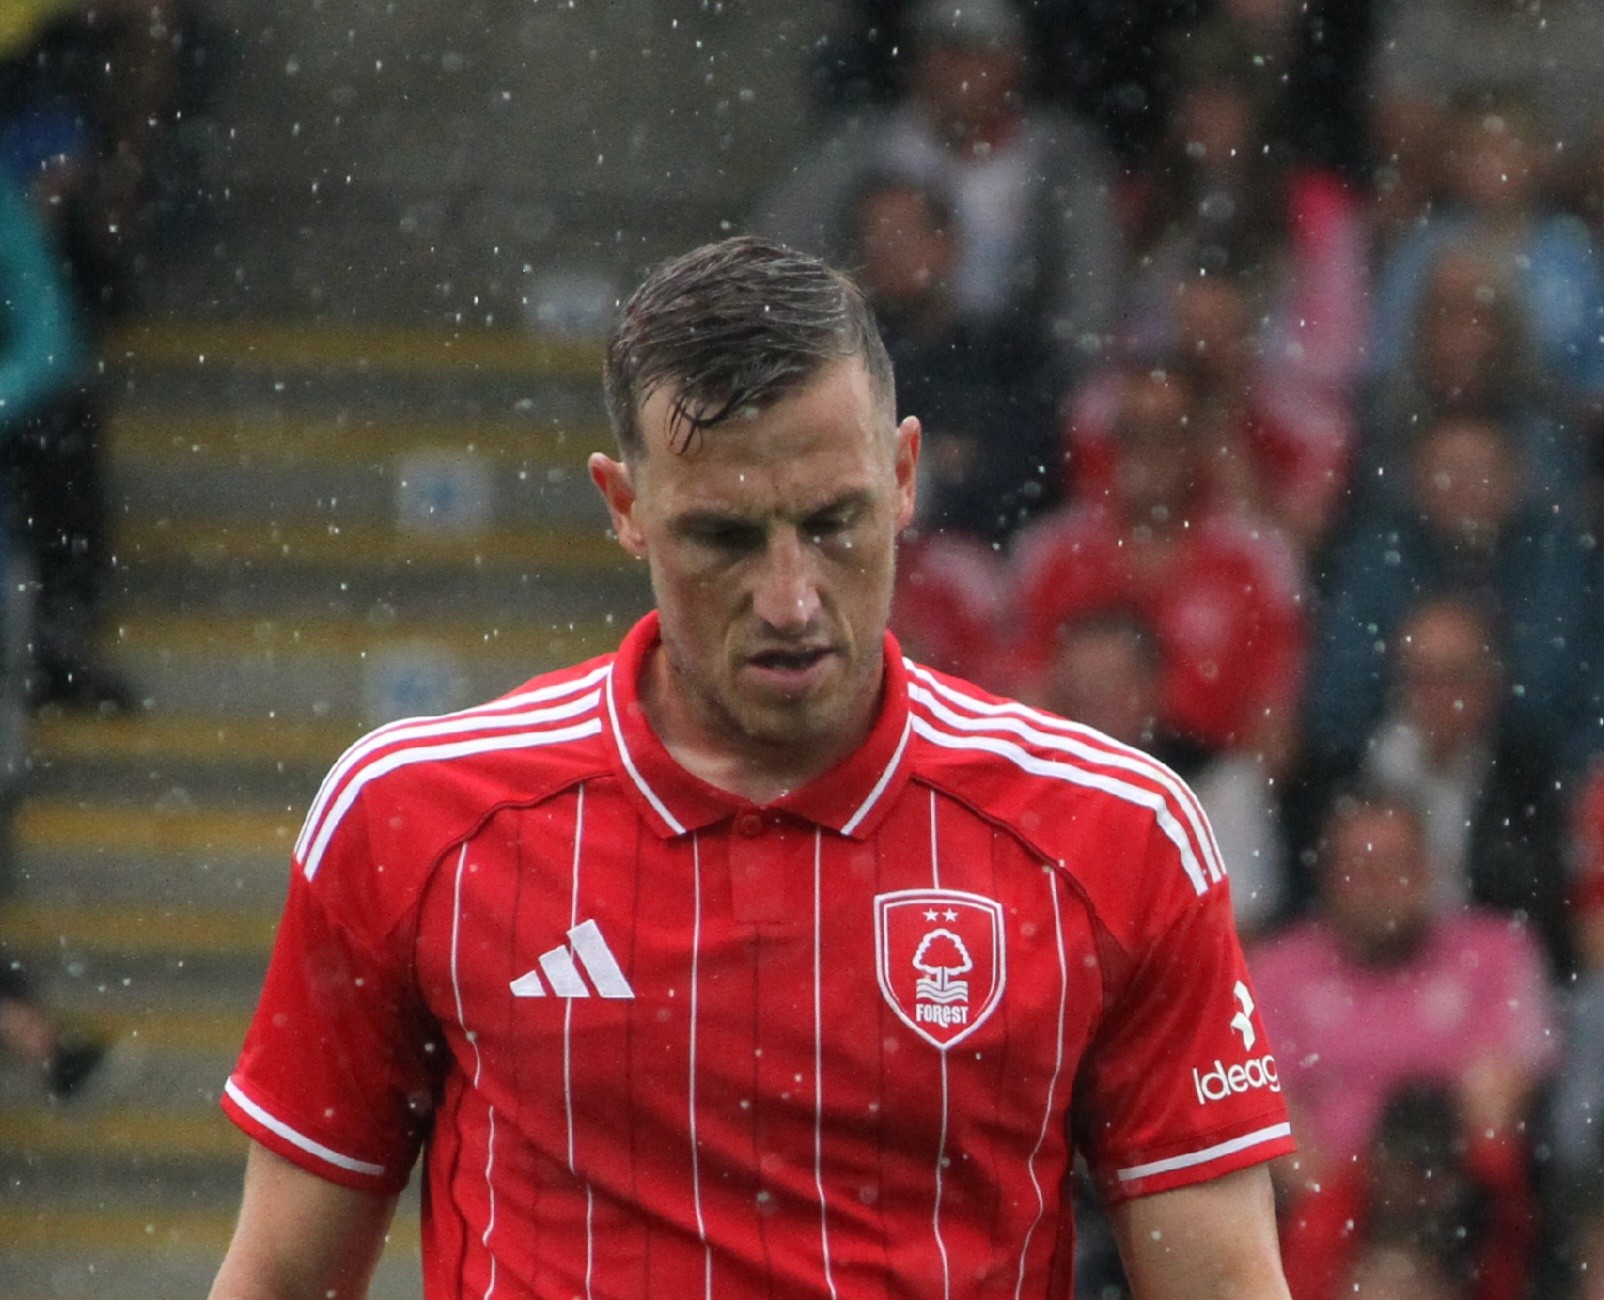
Chris Wood
New Zealand · Premier League · FW · NZL · age 35
The last dance
The Premier League striker carrying a country of five million
New Zealand has qualified for three World Cups. In 2010, they drew all three group matches and went home unbeaten but eliminated. Chris Wood was 18 and not in the squad. Fourteen years later, he is the reason they are back: 88 caps, 45 goals, the all-time leading scorer in the country's history by a distance, and the only player in this squad who plays in one of Europe's top five leagues.
At Nottingham Forest he has been a dependable Premier League striker for years, the kind of player who does not make highlight reels but finishes the season with double-digit goals more often than not. His composite rating (0.693) is the highest in the New Zealand squad by a wide margin, and the gap between him and the next-best outfield player tells the story of how much this team depends on one man.
Iran are heavy favourites today and the model sees New Zealand as the weakest team on the June 15 card. But Wood has scored at a rate that would be respectable for any international striker, and New Zealand have nothing to lose. For a country that plays rugby and cricket before football, every minute on the World Cup stage is a bonus, and Wood is the player who put them there.
2026 World Cup squad profile
- Team
- New Zealand
- Position
- FW
- Squad role
- Projected starter · #9
- Position rank
- #1
- Intl caps
- 88
- Intl goals
- 45
- Intl assists
- 7
- 0.69(model rating, 0–1)
- 37.3%
See Chris Wood on the full New Zealand scoring list →
Recent form
2024/25 club form vs the player's multi-season baseline (0.37 vs 0.38).
Career percentiles
vs 189 FW players with ≥3,000 career minutes in the dataset. Higher = better.
Career: goals & xG by season
Season-by-season
| Season | Club | League | Goals | Assists | ||||
|---|---|---|---|---|---|---|---|---|
| 2010-11 | West Brom | Premier League | 1 | 9 | 0 | 0 | — | — |
| 2014-15 | Leicester City | Premier League | 7 | 114 | 1 | 0 | — | — |
| 2017-18 | Burnley | Premier League | 24 | 1,624 | 10 | 1 | 7.0 | 0.6 |
| 2018-19 | Burnley | Premier League | 38 | 2,588 | 10 | 2 | 8.8 | 3.8 |
| 2019-20 | Burnley | Premier League | 32 | 2,437 | 14 | 1 | 15.7 | 1.8 |
| 2020-21 | Burnley | Premier League | 33 | 2,741 | 12 | 3 | 13.0 | 1.9 |
| 2021-22 | Burnley | Premier League | 17 | 1,367 | 3 | 0 | 4.7 | 0.6 |
| 2021-22 | Newcastle Utd | Premier League | 17 | 1,327 | 2 | 0 | 3.4 | 1.2 |
| 2022-23 | Newcastle Utd | Premier League | 12 | 152 | 0 | 0 | 0.6 | 0.1 |
▸How to read this table— 6 columns explained
- MP
- Matches played in that season (start or sub counts as one).
- Mins
- Total minutes on the pitch — better signal for workload than MP alone.
- Goals
- Goals scored (penalties included).
- Assists
- Passes that directly led to a goal (FBref attribution).
- xG
- Expected goals — per-shot quality scored 0–1 by distance / angle / pressure, summed across the season.
- xAG
- Expected assisted goals — the xG of shots created by this player's passes, summed.
Rest of the New Zealand squad
- Max Crocombe · GK
- Michael Boxall · DF
- Tim Payne · DF
- Liberato Cacace · DF
- Tommy Smith · DF
- Marko Stamenić · MF
- Elijah Just · MF
- Joe Bell · MF
- Kosta Barbarouses · FW
- Ben Waine · FW
- Tyler Bindon · DF
- Matthew Garbett · MF
- Callum McCowatt · MF
- Ben Old · MF
- Alex Rufer · MF
- Ryan Thomas · MF
- Francis de Vries · DF
- Finn Surman · DF
- Nando Pijnaker · DF
- Alex Paulsen · GK
- Callan Elliot · DF
- Jesse Randall · FW
- Michael Woud · GK
- Sarpreet Singh · MF
- Lachlan Bayliss · MF