Every World Cup group stage produces the same commentary. "They need this more." "Nothing to play for, expect rotation." "A draw is enough, they'll park the bus."
The implicit claim: teams in different motivational states produce different outcomes from what their quality alone would predict. A must-win team overperforms its Elo. A dead-rubber team underperforms. A draw-defending team produces more draws.
We tested this claim across 830 group-stage matches from 23 major tournaments (1990 to 2024). The answer is no. But the path from hypothesis to rejection is more interesting than the conclusion.
The setup
We built a state classification engine that, given the group standings before any match, assigns each team one of six states:
| State | Meaning |
|---|---|
| ALREADY_THROUGH | Qualified regardless of result |
| ELIMINATED | Cannot qualify regardless of result |
| MUST_WIN | Only qualifies with a win (no combination of other results helps) |
| DRAW_ENOUGH | Qualifies with a draw or better |
| BUBBLE | Qualification depends on a combination of own result + other matches |
| OPEN | Matchday 1, no prior info (the reference case) |
The classifier works by enumerating representative scorelines for all unplayed matches in the group, applying FIFA tiebreakers (points, goal difference, goals scored), and checking whether the team qualifies under every plausible combination. It is unit-tested against synthetic fixtures and the canonical 1982 "Disgrace of Gijon" case.
The baseline model is Elo-only match probabilities (logistic on Elo gap, 22% constant draw probability). We chose the simplest available baseline because the question is whether motivation states carry information beyond team quality, not whether the full ensemble is well-calibrated.
The corpus: World Cups 1990 through 2022, Euros 2004 through 2024, Copa America 2019 through 2024, AFCON 2019 through 2023, Asian Cup 2019 and 2023. All group-stage matches with complete results.
The first result: fragments too small to conclude
Crossing two teams' states produces many pair combinations. Most are rare:
| State pair | n | Brier | Delta vs OPEN |
|---|---|---|---|
| open x open | 238 | 0.554 | reference |
| bubble x bubble | 365 | 0.598 | +0.044 |
| bubble x draw_enough | 59 | 0.640 | +0.086 |
| already_through x bubble | 29 | 0.631 | +0.077 |
| draw_enough x must_win | 23 | 0.582 | +0.028 |
| already_through x already_through | 15 | 0.558 | +0.004 |
| eliminated x eliminated | 14 | 0.457 | -0.097 |
No cell with 30+ matches has a 95% bootstrap confidence interval that excludes zero. The per-cell approach fragments 830 matches into 14 cells, leaving most below any reasonable significance threshold.
Pooling into mechanistic groups
To rescue statistical power, we grouped state pairs into five pools based on the mechanism they test:
| Pool | n | Brier | Delta vs reference | 95% CI |
|---|---|---|---|---|
| Reference (OPEN x OPEN, MD1) | 238 | 0.554 | — | — |
| Standard competition (BUBBLE x BUBBLE) | 365 | 0.598 | +0.044 | [-0.027, +0.107] |
| Draw defending (any DRAW_ENOUGH pair) | 123 | 0.633 | +0.079 | [-0.009, +0.170] |
| Dead rubber (both THROUGH or ELIM) | 41 | 0.495 | -0.060 | [-0.170, +0.055] |
| Asymmetric other | 63 | 0.572 | +0.018 | [-0.110, +0.153] |
The draw-defending pool is the strongest candidate: +0.079 Brier worse than the reference, confidence interval nearly excluding zero. The observed draw rate is elevated (29.3% vs the model's 21.8% prediction), consistent with the "park the bus" hypothesis.
This is where most studies would stop and report the finding.
The confounder
But there is a structural problem. Motivation states are not randomly distributed across matchdays. Must-win, draw-enough, and dead-rubber states overwhelmingly cluster on matchday 3 (the final group game). The OPEN reference is entirely matchday 1. Any comparison between them is confounded by matchday position.
Why does matchday matter independently of motivation? Several mechanisms:
- Tactical adaptation. By matchday 3, coaches have seen both opponents play. Adjustments narrow expected outcome ranges.
- Form information. Two results are already in. The pre-tournament Elo snapshot is now stale by a larger margin.
- Group dynamics. With standings established, the range of plausible outcomes has collapsed. This is irreducible uncertainty that the matchday-1 baseline never faces.
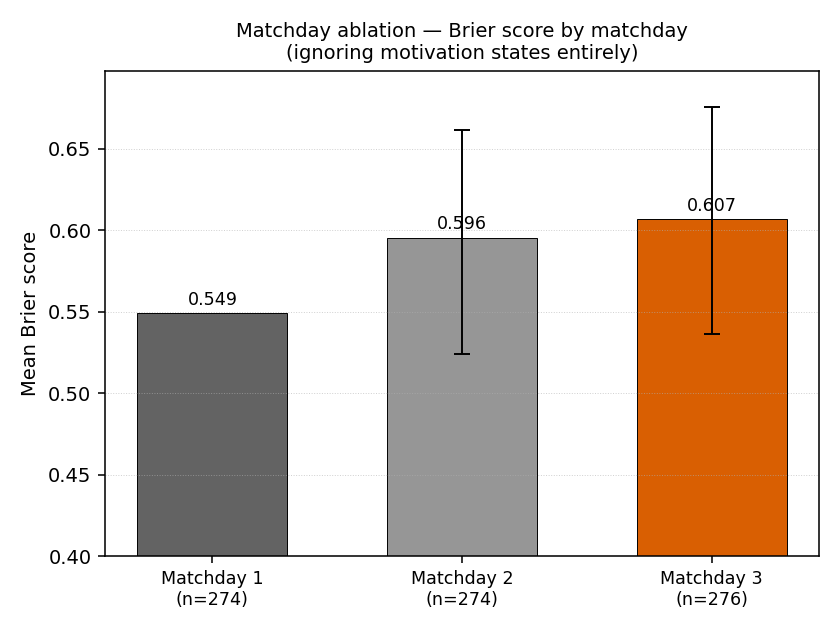
We tested the matchday effect directly, ignoring motivation states entirely:
| Matchday | n | Brier | Delta vs MD1 | 95% CI |
|---|---|---|---|---|
| 1 | 274 | 0.549 | — | — |
| 2 | 274 | 0.596 | +0.046 | [-0.025, +0.112] |
| 3 | 276 | 0.607 | +0.058 | [-0.013, +0.126] |
Matchday 3 is +0.058 Brier worse than matchday 1 across all matches. This accounts for most of the draw-defending signal (+0.079). The question becomes: after holding matchday constant, does the motivation label add anything?
The definitive test
We restricted to matchday-3 matches only and compared pools within that slice:
| Pool (MD3 only) | n | Brier | Observed draw rate |
|---|---|---|---|
| Standard competition | 52 | 0.645 | 28.8% |
| Draw defending | 120 | 0.642 | 30.0% |
| Dead rubber | 39 | 0.509 | 17.9% |
Draw defending vs standard competition on matchday 3: delta = -0.003. 95% CI [-0.138, +0.130].
Zero. The motivation label adds no information once you are already on matchday 3. The draw-defending matches and the standard-competition matches are equally hard to predict.
The surprise: dead rubbers are easier, not harder
The conventional wisdom says dead rubbers produce chaotic results. Rotation, experimentation, players on the beach. The prediction should be: dead rubbers are harder to forecast.
The data says the opposite. At matchday 3, dead rubbers have a Brier of 0.509 versus 0.645 for standard competition (delta = -0.136, CI [-0.285, +0.024]). When both teams have nothing to play for, variance drops and the Elo-based prediction (which tends toward the prior) becomes better calibrated.
The mechanism is straightforward: dead rubbers produce fewer surprises. The better team wins at their base rate. Without tournament pressure distorting tactics (no parking the bus, no kamikaze attacking), outcomes revert to what team-quality models expect.
What we did ship
The study produced no motivation adjustment. But it revealed a genuine calibration problem: the model's fixed 22% draw probability systematically underestimates group-stage draw rates across all pools. The observed rate ranges from 24.8% (reference) to 30.0% (draw defending on MD3).
We shipped two fixes:
- A calibrator bypass for group-stage matches (the tournament-tier isotonic curve was pooling group-stage draws with knockout-stage non-draws and suppressing the prediction).
- A multiplicative draw scaling factor (1.05 post-extremization), Brier-optimized on the full 830-match corpus.
Combined improvement: -2.7% Brier on group-stage predictions. Found by investigating a motivation hypothesis that turned out to be wrong.
Lessons
Confounders in football analytics are structural, not subtle. The matchday confounder is obvious in retrospect. Motivation states are defined by when they occur in the tournament. Comparing "open" (matchday 1) to "draw-defending" (matchday 3) without controlling for matchday is comparing apples to oranges. Yet the football economics literature (Brams & Ismail 2018) reports motivation effects without this control.
Small-sample reversion to the mean is real. The most suggestive cell in our earlier 14-edition analysis was "draw_enough x must_win" at n=13 with a 46% draw rate. After doubling the corpus to 23 editions (n=23), this regressed to 30%. The initial finding was noise.
Negative results should ship fixes, not just conclusions. The motivation study itself was a dead end. But the systematic analysis of group-stage draw rates (which only happened because we were looking for motivation effects) led to a calibration fix worth 2.7% Brier. The most valuable finding was adjacent to the hypothesis, not the hypothesis itself.
Pre-define your gate. We specified four criteria before running the analysis: minimum sample size, delta threshold, CI excluding zero, and matchday control. The analysis failed criteria 3 and 4. Without pre-commitment, it would be tempting to argue that CI [-0.009, +0.170] "nearly excludes zero" and ship anyway.
Reproducibility
The full analysis pipeline is open:
- State classification engine:
scripts/_motivation_state.py - Residual backtest:
scripts/backtest_motivation_residuals.py - 830 matches across 23 tournament editions (1990 to 2024)
- 2000 bootstrap resamples, seed 1729
- Pre-defined decision gate with four conjunctive criteria
The research note with all tables and intermediate results is published at /research/notes/hidden-motivations.