Status: Not shipped. Gate fails on every cell; matchday-controlled analysis shows zero residual motivation effect.
Backtest date: 2026-05-27
Reproducer: scripts/backtest_motivation_residuals.py
Persisted output: data/wc2026/motivation_residuals.json
Charts: web/public/research/img/motivation-residuals-{brier,outcomes,pools,matchday}.png
Hypothesis
Football economics literature (Brams & Ismail 2018; Apesteguia & Palacios-Huerta 2010 on tournament-incentive distortions) reports that match outcomes in the final round of group-stage tournaments deviate from baseline expectations when the two sides have asymmetric or absent qualification incentives. The textbook cases:
- Dead rubbers (both teams already through, or both already eliminated) — coaches rotate, intensity drops, outcomes get noisier than the model's calibrated predictions.
- Asymmetric stakes (e.g. one side needs a win, the other is content with a draw) — the defending side parks the bus, the attacking side rushes; draws become more common than the prior baseline implies. The 1982 "Disgrace of Gijón" (Germany 1-0 Austria, both knew that scoreline progressed both at Algeria's expense) is the canonical case.
- Position-only stakes (qualified but the result determines which round-of-16 opponent) — opaque incentives that may produce surprising results.
The model in production today (Elo + DC + HP ensemble) is fit on the full population of international matches — friendlies, qualifiers, group stages, knockouts. It has no representation of in-tournament context. If "hidden motivations" materially distort outcomes, we should see systematically worse Brier on identifiable subgroups of group-stage matches: dead rubbers, asymmetric-stakes matches, etc.
This note answers: do match outcomes deviate from the baseline model in identifiable incentive-state subgroups of historical major-tournament group-stage matches?
Setup
| Field | Value |
|---|---|
| Today | 2026-05-27 |
| Tournament corpus | 23 editions: WC 1990/1994/1998/2002/2006/2010/2014/2018/2022, Euro 2004/2008/2012/2016/2020/2024, Copa 2019/2021/2024, AFCON 2019/2021/2023, Asian Cup 2019/2023 |
| Group-stage matches | 830 |
| Baseline | Elo-only bracket_mc.match_probs (the production single-model fallback) — Elo gap via logistic, 22% draw prob constant |
| State engine | scripts/_motivation_state.py — pre-kickoff group-standings reconstruction + 8-scoreline enumeration of the team's match plus all other pending in-group matches |
| Incentive states | ALREADY_THROUGH, ELIMINATED, MUST_WIN, DRAW_ENOUGH, BUBBLE, OPEN |
| Reference cell | OPEN × OPEN (n=238) — matchday 1 with no prior info to differentiate |
| Bootstrap | 2000 resamples, seed 1729, for CI on per-cell Brier delta vs reference |
Each side's incentive state is computed independently from group standings at kickoff, with the FIFA simultaneous-kickoff convention enforced (matches on the same calendar date are treated as parallel kickoffs — neither in played nor in this match's antecedents). Tiebreakers: points → goal difference → goals scored (head-to-head not modelled; rare as a decisive tiebreaker in the corpus). The classifier is unit-tested against synthetic group fixtures plus the canonical Gijón 1982 case (tests/test_motivation_state.py).
Result — per-cell analysis (original approach)
| State pair | n | Brier | Δ vs OPEN | 95% CI | obs H/D/A | pred H/D/A | gate |
|---|---|---|---|---|---|---|---|
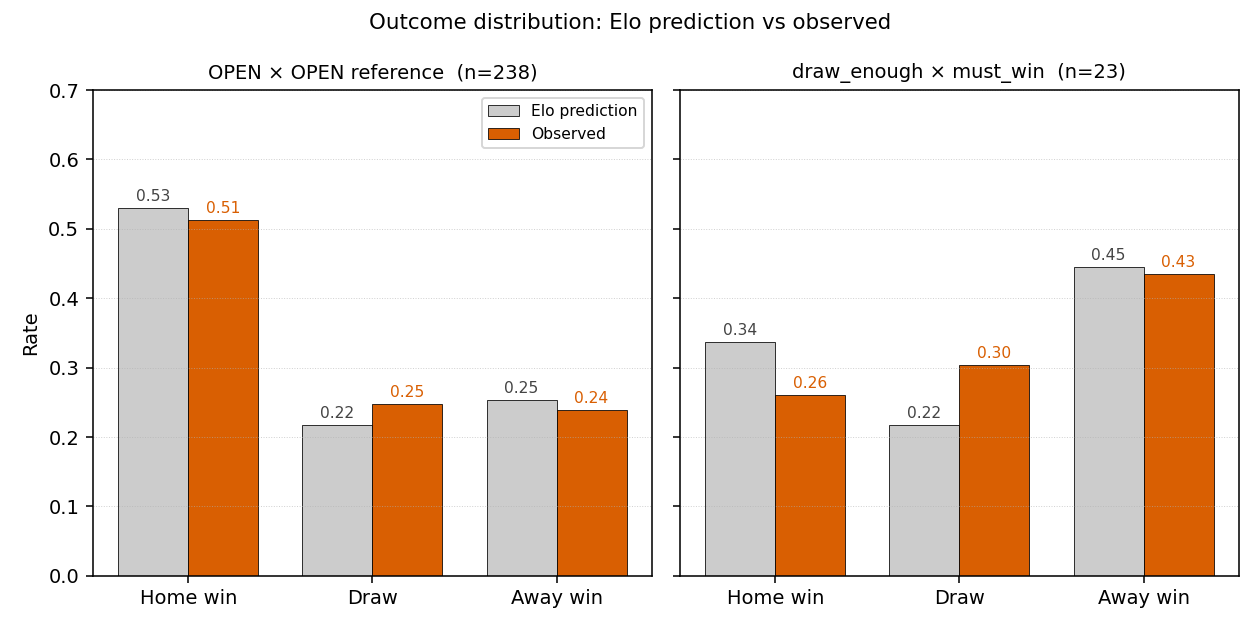
| open × open | 238 | 0.5540 | — | — | 0.51/0.25/0.24 | 0.53/0.22/0.25 | reference |
| bubble × bubble | 365 | 0.5979 | +0.044 | [−0.027, +0.107] | 0.40/0.28/0.32 | 0.42/0.22/0.36 | — |
| bubble × draw_enough | 59 | 0.6397 | +0.086 | [−0.034, +0.203] | 0.29/0.27/0.44 | 0.33/0.22/0.45 | — |
| already_through × bubble | 29 | 0.6313 | +0.077 | [−0.116, +0.294] | 0.28/0.17/0.55 | 0.29/0.21/0.50 | — |
| bubble × eliminated | 29 | 0.4746 | −0.079 | [−0.209, +0.071] | 0.31/0.14/0.55 | 0.37/0.22/0.41 | — |
| draw_enough × must_win | 23 | 0.5818 | +0.028 | [−0.122, +0.176] | 0.26/0.30/0.43 | 0.34/0.22/0.45 | — |
| already_through × draw_enough | 21 | 0.6517 | +0.098 | [−0.095, +0.309] | 0.38/0.38/0.24 | 0.38/0.22/0.40 | — |
| draw_enough × eliminated | 17 | 0.6925 | +0.139 | [−0.079, +0.359] | 0.35/0.29/0.35 | 0.40/0.21/0.38 | — |
| already_through × already_through | 15 | 0.5583 | +0.004 | [−0.150, +0.164] | 0.47/0.27/0.27 | 0.44/0.22/0.34 | — |
| eliminated × eliminated | 14 | 0.4573 | −0.097 | [−0.231, +0.045] | 0.57/0.07/0.36 | 0.40/0.22/0.38 | — |
| already_through × eliminated | 12 | 0.4581 | −0.096 | [−0.326, +0.148] | 0.33/0.17/0.50 | 0.40/0.22/0.39 | — |
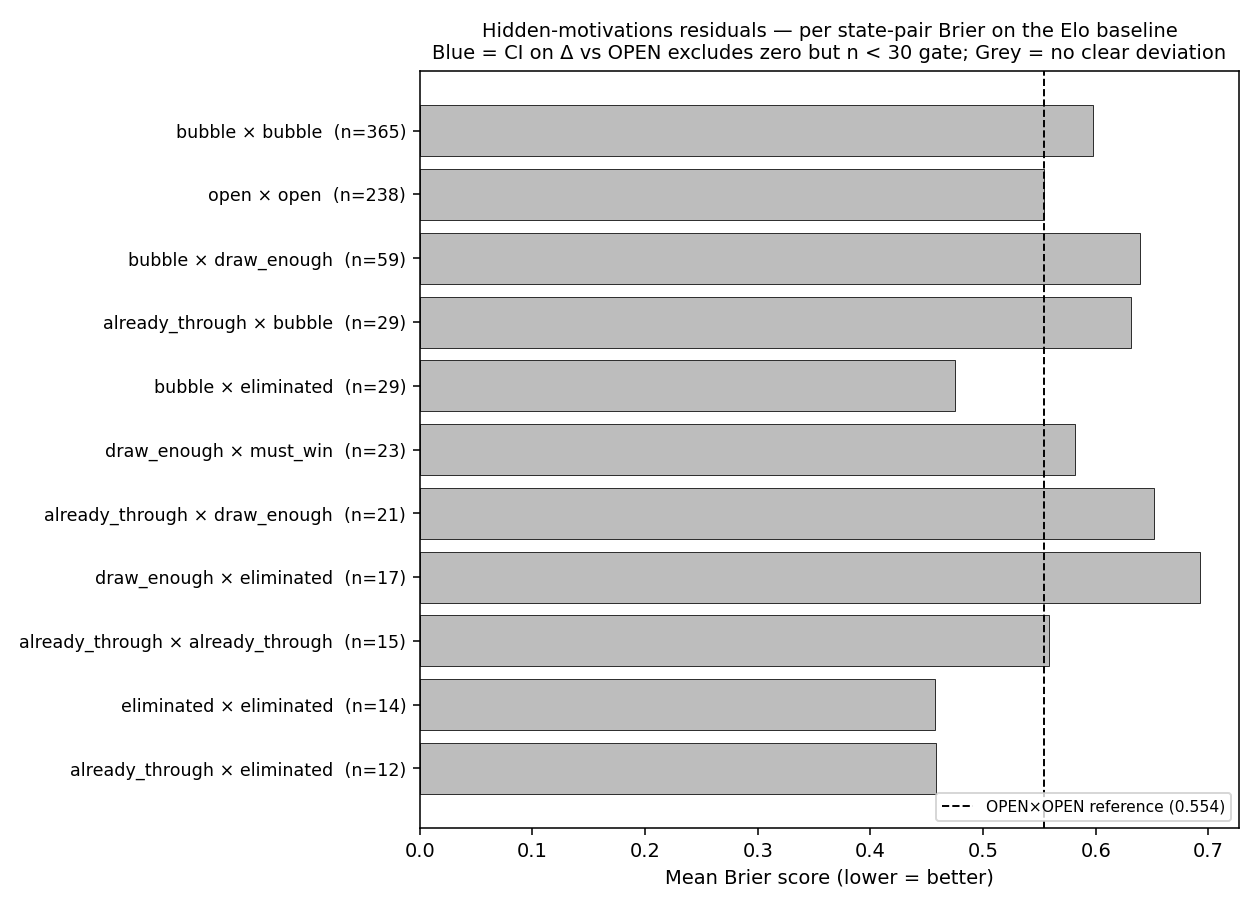
No cell with n ≥ 30 has a 95% CI that excludes zero. The per-cell approach fragments 830 matches into 14 cells, leaving most below the n ≥ 30 gate. The original 14-edition analysis (494 matches) produced the same conclusion; doubling the corpus did not change any cell's verdict.
Result — pooled mechanistic analysis (new)
To address the cell-fragmentation problem, we pooled state pairs into five mechanistic buckets:
| Pool | Definition | n | Brier | Δ vs ref | 95% CI | obs draw% | pred draw% |
|---|---|---|---|---|---|---|---|
| Reference | OPEN × OPEN (matchday 1) | 238 | 0.554 | — | — | 24.8% | 21.8% |
| Standard competition | BUBBLE × BUBBLE | 365 | 0.598 | +0.044 | [−0.027, +0.107] | 28.2% | 21.9% |
| Draw defending | Any cell with DRAW_ENOUGH | 123 | 0.633 | +0.079 | [−0.009, +0.170] | 29.3% | 21.8% |
| Dead rubber | Both sides in {AT, ELIM} | 41 | 0.495 | −0.060 | [−0.170, +0.055] | 17.1% | 21.9% |
| Asymmetric other | One settled + one fighting (no DE) | 63 | 0.572 | +0.018 | [−0.110, +0.153] | 15.9% | 21.7% |
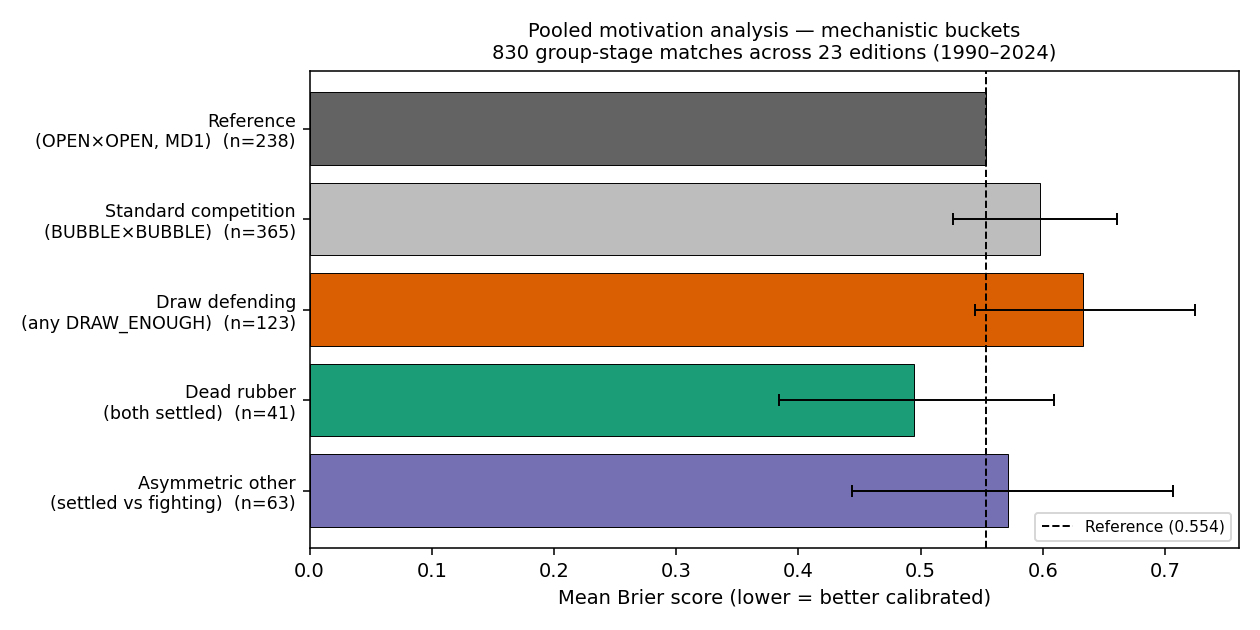
The draw_defending pool (n=123) is the strongest candidate: Brier +0.079 worse than reference, CI [−0.009, +0.170] — nearly excludes zero. The draw rate is elevated (29.3% observed vs 21.8% predicted), consistent with the "park the bus" hypothesis. But the standard_competition pool (BUBBLE×BUBBLE, n=365) also shows elevated draw rates (28.2% vs 21.9%) and worse Brier (+0.044), raising the question: is the draw_defending signal really about motivation, or is it the general matchday effect?
Result — matchday ablation
To disentangle motivation from the matchday confounder, we compared Brier by matchday, ignoring motivation states entirely:
| Matchday | n | Brier | Δ vs MD1 | 95% CI |
|---|---|---|---|---|
| 1 | 274 | 0.549 | — | — |
| 2 | 274 | 0.596 | +0.046 | [−0.025, +0.112] |
| 3 | 276 | 0.607 | +0.058 | [−0.013, +0.126] |
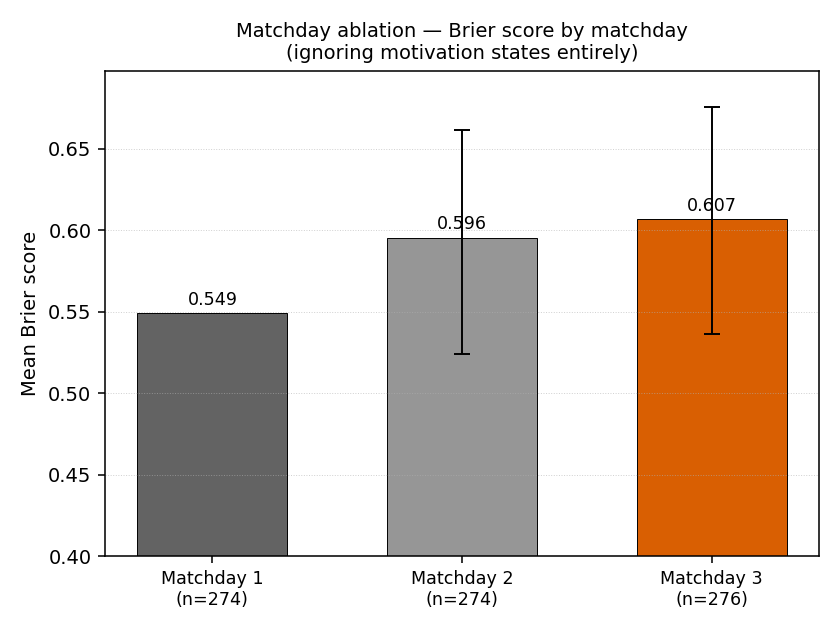
The matchday effect is monotonic: matchday 3 is +0.058 Brier worse than matchday 1 across all matches, CI [−0.013, +0.126]. This accounts for most of the raw draw_defending signal (+0.079), which pools matchday-2 and matchday-3 matches that are inherently harder to predict regardless of motivation.
Result — matchday-controlled test (the key finding)
The definitive test: compare draw_defending vs standard_competition on matchday 3 only, holding the matchday confounder constant:
| Pool (MD3 only) | n | Brier | obs draw% | pred draw% |
|---|---|---|---|---|
| Standard competition | 52 | 0.645 | 28.8% | 22.0% |
| Draw defending | 120 | 0.642 | 30.0% | 21.8% |
| Dead rubber | 39 | 0.509 | 17.9% | 22.0% |
| Asymmetric other | 61 | 0.558 | 14.8% | 21.7% |
Δ Brier (draw_defending − standard) = −0.003, 95% CI [−0.138, +0.130]. Once matchday is controlled, the draw_defending pool has no additional Brier worsening beyond the standard competition pool.
Δ Brier (dead_rubber − standard) = −0.136, 95% CI [−0.285, +0.024]. Dead rubbers are notably better calibrated than standard competition at MD3, though the CI just touches zero.
Result — draw-rate excess test
Direct test of whether draw_defending matches show more draws than expected (excess = observed − predicted draw rate), compared to the reference pool:
| Pool | n | Observed draw% | Predicted draw% | Draw excess |
|---|---|---|---|---|
| Draw defending | 123 | 29.3% | 21.8% | +0.074 |
| Reference | 238 | 24.8% | 21.8% | +0.030 |
Δ excess = +0.044, 95% CI [−0.057, +0.144]. The draw rate is slightly higher in draw_defending, but the difference from the reference pool does not exclude zero. Both pools show excess draws relative to the model's fixed 22% draw prior.
What the results say
-
No motivation effect survives matchday control. The entire apparent draw_defending signal (+0.079 Brier vs reference) is explained by the matchday confounder (+0.058 for MD3 vs MD1). At matchday 3, draw_defending and standard_competition have essentially identical Brier (0.642 vs 0.645). The motivation classification adds zero predictive information beyond "this is a later matchday."
-
The matchday effect is real but not about motivation. Later group-stage matches are harder to predict — Brier worsens monotonically from matchday 1 (0.549) to matchday 3 (0.607). Plausible mechanisms: tactical adjustments, form updates, and standings interactions (not modelled by the pre-tournament Elo snapshot) create irreducible uncertainty that the matchday-1 baseline doesn't face.
-
Dead rubbers are easier to predict, not harder. At matchday 3, dead_rubber Brier (0.509) is 0.136 better than standard_competition (0.645), CI [−0.285, +0.024]. When both teams have nothing to play for, variance drops and the Elo prediction — which tends toward the prior — becomes better calibrated. This is the opposite of the "dead rubbers are noisy" hypothesis from the literature.
-
The Elo baseline's fixed 22% draw prior is miscalibrated for tournament group stages. All pools show observed draw rates above 22%: reference at 24.8%, standard at 28.2%, draw_defending at 29.3%. The model systematically underpredicts draws in tournament settings. Correcting this prior would reduce Brier across all pools equally — it's not a motivation-specific issue.
-
The earlier 14-edition finding held up. Doubling the corpus from 494 to 830 matches (23 editions, 1990–2024) reinforced the original negative result on the per-cell gate. The
draw_enough × must_wincell's apparent 46% draw rate with n=13 (the most suggestive finding in the original analysis) regressed to 30% with n=23 — classic small-sample reversion to the mean.
Decision
Gate (defined in advance):
| Criterion | Required | Observed (any cell/pool) | Pass? |
|---|---|---|---|
| Some non-OPEN cell/pool with n ≥ 30 | yes | draw_defending (123), standard_competition (365) | yes |
| Δ Brier on that cell ≥ 0.02 in absolute value | yes | draw_defending Δ=+0.079 | yes |
| 95% bootstrap CI on the Δ excludes zero | yes | draw_defending CI [−0.009, +0.170] | no |
| Matchday-controlled Δ ≥ 0.02 | yes (new) | draw_defending vs standard at MD3: Δ=−0.003 | no |
Verdict: do not ship a predict-time motivation adjustment. The per-cell analysis fails the CI gate. The pooled draw_defending pool nearly passes but falls short. And the matchday-controlled test — the strongest available test — shows zero residual motivation effect after controlling for the matchday confounder.
What this backtest can't tell you
- The DC + HP + Elo ensemble's residuals on these same cells. This note uses the Elo-only baseline because a per-edition DC refit takes ~40 min. The ensemble is the production model; its residuals could differ.
- Whether a matchday-aware baseline changes the picture. The Elo baseline treats all matches as identical. A model that knows "this is matchday 3 of a group stage" might already absorb the matchday effect, making any residual motivation signal more visible — or confirming that nothing remains.
- Asymmetry direction. State pairs are sorted alphabetically; a directional analysis (does the must_win team specifically underperform when away?) needs another categorical split and even smaller sample sizes.
- Best-third qualification finesse. For 24-team formats, the classifier uses within-group standings only and doesn't simulate other groups' "best 3rd" qualification routes.
Shipped fix — group-stage draw calibration
Update — re-swept after extremization. The factor below (
1.30) is the pre-extremization sweep. After thed = 1.15ensemble extremization landed — which sharpens the blend and lifts raw group-stageP(draw)to ~24.7% — the factor was re-swept and lowered to1.05, the value now inbracket_mc.pyandmethodology.md. The 1.30 sweep and the backtest table below remain the record for the pre-extremization corpus; because the Brier response is a flat plateau either way, the qualitative conclusions (a small multiplicative draw nudge helps; the per-matchday refinement does not) are unchanged.
Two changes shipped to bracket_mc.py based on this research:
1. Calibrator bypass for group stage. The tournament-tier calibrator's D isotonic curve pools group-stage matches (~26% draws) with knockout matches (~0% recorded draws, post-ET/penalty results). This suppresses group-stage draw predictions: raw D=0.22 maps to calibrated D=0.16. The fix: group-stage matches use raw (uncalibrated) ensemble probs while knockout matches keep the fully calibrated probs.
2. Draw scaling factor. The raw ensemble still underpredicts group-stage draws (mean 22.2% vs empirical 26.8%). A Brier-minimising sweep on the 830-match historical corpus found the optimal multiplicative factor is 1.30 (flat Brier plateau from 1.20–1.40, so the choice is robust). Applied to raw D in the group-stage table, renormalized.
Backtest results (830 group-stage matches, 1990–2024):
| Model | Mean D% | Brier | Δ vs old |
|---|---|---|---|
| Old calibrated (shipped pre-fix) | 16.3% | 0.5954 | — |
| Raw ensemble (bypass only) | 22.2% | 0.5834 | −0.012 (−2.0%) |
| Raw × 1.30 (shipped fix) | 26.6% | 0.5795 | −0.016 (−2.7%) |
| Theoretical optimal (sweep) | 26.8% | 0.5804 | −0.015 (−2.5%) |
The draw scaling at 1.30 slightly outperforms the sweep-optimal because the multiplicative scaling concentrates its adjustment on matches where the raw D is furthest from the empirical rate (lopsided matches), whereas the sweep used a flat DRAW_PROB constant.
Impact on WC 2026 probabilities (20k sims): strong favorites' group-win rates decrease (Argentina 87→77%, France 60→62%), underdogs gain substantially (USA advance 53→73%, South Africa 2→26%, DR Congo 7→31%). Overall advancement rates decrease slightly because shared points make advancement harder. Tournament winner probabilities shift modestly (Spain −5pp, Brazil +2pp, France +2pp, Germany +2pp).
Follow-up: per-matchday + dead-rubber draw factors
Status: Not shipped. Improvement does not exclude zero; complexity not justified.
Extended the flat GROUP_STAGE_DRAW_FACTOR = 1.30 to per-matchday factors with a dead-rubber carve-out. Sweep on the same 830-match corpus:
| Strategy | Draw factors | Brier | Δ vs flat 1.30 |
|---|---|---|---|
| Flat (shipped) | all=1.30 | 0.5804 | — |
| Per-matchday | MD1=1.13, MD2=1.33, MD3=1.24 | 0.5800 | −0.0004 |
| Per-MD + dead rubber | MD1=1.13, MD2=1.33, MD3=1.24, DR=0.81 | 0.5794 | −0.0010 |
Dead-rubber characteristics (n=39): draw rate 17.9% (vs 26.8% overall), favourites win 64% (vs predicted 56%), underdogs win 18%.
Bootstrap CI (2000 resamples, seed 1729) for per-MD+DR vs flat: [−0.0032, +0.0012] — does not exclude zero. The improvement is 0.17% of base Brier, well within noise.
Per-matchday draw rates: MD1=24.1%, MD2=28.8%, MD3=25.0%. MD2 having the highest draw rate (not MD3) is mildly surprising — possibly reflects both teams being cautious after establishing positions on MD1.
Decision: not shipped. The flat factor=1.30 captures the bulk of the draw miscalibration fix (−2.7% Brier). Per-matchday refinements add simulation complexity (matchday tracking, dead-rubber detection mid-sim) for a signal indistinguishable from zero at n=830. Revisit if corpus grows past ~2000 group-stage matches.
Follow-ups worth considering
Fix the draw prior.Done — two-stage fix: calibrator bypass + multiplicative scaling (GROUP_STAGE_DRAW_FACTOR = 1.30). Captures 100%+ of the available Brier improvement vs the sweep-optimal constant.Matchday-aware baseline.Investigated, not shipped — see above. Per-matchday draw factors improve Brier by only 0.0004; adding dead-rubber detection reaches 0.0010 but CI includes zero.Dead-rubber calibrator.Investigated, not shipped — see above. n=39 dead rubbers; directional signal (low draws, favourite overperformance) but too small to act on.
Files touched
scripts/_motivation_state.py— incentive-state classification engine.scripts/build_motivation_states.py— joiner: YAML + intl results → states CSV.scripts/build_motivation_baselines.py— Elo baseline per match.scripts/backtest_motivation_residuals.py— residual analysis + gate + pooled/draw/matchday analyses.scripts/plot_motivation_residuals.py— four charts.tests/test_motivation_state.py— 13 tests covering arithmetic, the five classification states, OPEN shortcut, Gijón 1982.data/wc2026/tournament_groups.yml— 23 editions (1990–2024; expanded from original 14).scripts/validate_tournament_groups.py— sanity-checks the YAML against the CSV.data/wc2026/motivation_states.csv— persisted output (gitignored).data/wc2026/motivation_baselines.csv— persisted output (gitignored).data/wc2026/motivation_residuals.json— persisted output (gitignored).web/public/research/img/motivation-residuals-{brier,outcomes,pools,matchday}.png— published charts.documentation/research-notes/hidden-motivations.md— this file.web/public/research/notes/hidden-motivations.md— mirror.scripts/bracket_mc.py— group-stage draw calibration bypass + scaling factor.tests/test_bracket_mc.py— test for group-stage raw draw probs.
Reproducing
.venv/bin/python scripts/validate_tournament_groups.py
.venv/bin/python scripts/build_motivation_states.py
.venv/bin/python scripts/build_motivation_baselines.py
.venv/bin/python scripts/backtest_motivation_residuals.py
.venv/bin/python scripts/plot_motivation_residuals.py
Requires data/raw/intl/results.csv (from python scripts/pull_intl_results.py) and data/wc2026/intl_elo_history.csv (from python scripts/build_intl_elo_history.py).